Email-based Usage Reports (TDL-hosted repositories only)
Repository usage reports are delivered via email to managers of TDL-hosted repositories on a monthly basis.
These reports include usage statistics at the Repository, Community, Collection, and Item Level. The reports are delivered in Microsoft Excel format as an email attachment to one or multiple email addresses designated by the repository manager.
To change the destination email address(es) for these reports, please contact the TDL Helpdesk at support@tdl.org.
Below is a list of statistics provided in the reports
Repository-level statistics
Items added last month (number of items added to the repository in the previous month)
Items added in academic year (number of items added year-to-date using a September-August year)
Total Items (total number of items in repository on the date the report was generated)
Item views last month (number of item views in the previous month)
Item views in academic year (number of item view year-to-date using a September-August year)
Total item views (total number of item views since start of statistics-gathering)
Item downloads last month (number of downloads in the previous month)
Item downloads in academic year (number of downloads year-to-date using a September-August year)
Total item downloads (total number of downloads)
Community-level statistics
Community ID
Community Name
Community URL
Parent Community Name
Items added last month
Items added in academic year
Total Items
Item views last month
Item views in academic year
Total item views
Item downloads last month
Item downloads in academic year
Total item downloads
Collection-level Statistics
Parent Community Name
Collection ID
Collection Name
Collection URL
Items added last month
Items added in academic year
Total Items
Item views last month
Item views in academic year
Total item views
Item downloads last month
Item downloads in academic year
Total item downloads
Item-level Statistics
Collection Name
Item ID
Item Title
Item URL
Item views last month
Item views in academic year
Total item views
Item downloads last month
Item downloads in academic year
Total item downloads
Usage Statistics in the DSpace UI
TDL-hosted DSpace repositories use the Apache SOLR application underlying the statistics. SOLR enables performant searching and adding to vast amounts of (usage) data. For more about SOLR statistics in the DSpace application see the LYRASIS Wiki.
There are two areas where SOLR-based statistics can be viewed: in the “context-dependent” STATISTICS section at the bottom of the right navigation menu and the Administrative menu (available only to repository administrators) under STATISTICS. The context-dependent stats show usage at different levels of the repository (Community, Collection, Item). The Administrative stats are repository-wide.
A note about bots and spiders
Usage statistics should, as much as possible, reflect genuine, user-driven trafficc and not the work of bots and spiders crawling the site. To prevent inflation of usage statistics, TDL excludes bots and spiders from the SOLR-based statistics using the official list maintained by Project COUNTER, using tools maintained by Atmire. This list of exclusions is updated monthly in TDL-hosted DSpace repositories.
Context-dependent Statistics
In a TDL-hosted DSpace repository, pageview and download statistics can be accessed from the lower end of the navigation menu. You can view Usage Statistics (page views and file downloads), search statistics, and workflow statistics.
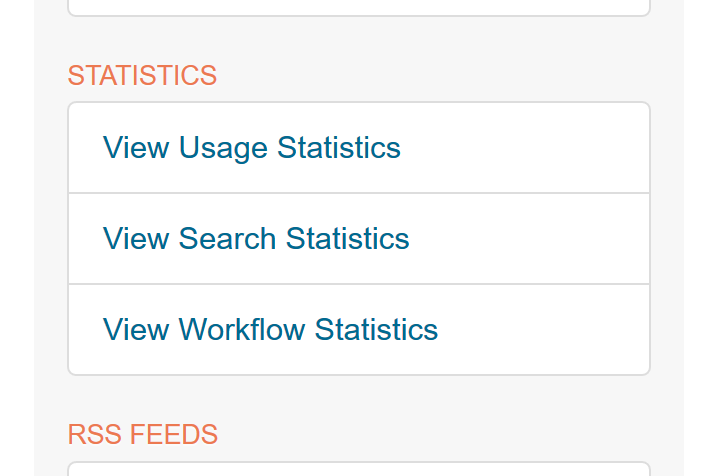
By default these links are only available to Repository Administrators. You can request that TDL make any of all of these statistics publicly available on the site by sending a request to the TDL Helpdesk at support@tdl.org.
Pageview and Download statistics
The Usage Statistics link is context-dependent, meaning that you will see different statistics depending on where you are in the repository when you click on it.
Home page
Starting from the repository homepage, the statistics page displays the top 10 most popular items of the entire repository.
Community home page
The following statistics are available for the community home pages:
Total visits of the current community home page (Please note: this is not the number of views of all items within the Community, but instead the number of views of this Community home page).
Visits of the community home page over a timespan of the last 7 months
Top 10 countries from where the visits originate
Top 10 cities from where the visits originate
Collection home page
The following statistics are available for the collection home pages:
Total visits of the current collection home page (Please note: this is not the number of views of all items within the Collection, but instead the number of views of this Collection home page).
Visits of the collection home over a timespan of the last 7 months
Top 10 country from where the visits originate
Top 10 cities from where the visits originate
Item home page
The following statistics are available for the item home pages:
Total visits of the item
Total visits for the bitstreams attached to the item
Visits of the item over a timespan of the last 7 months
Top 10 country views from where the visits originate
Top 10 cities from where the visits originate
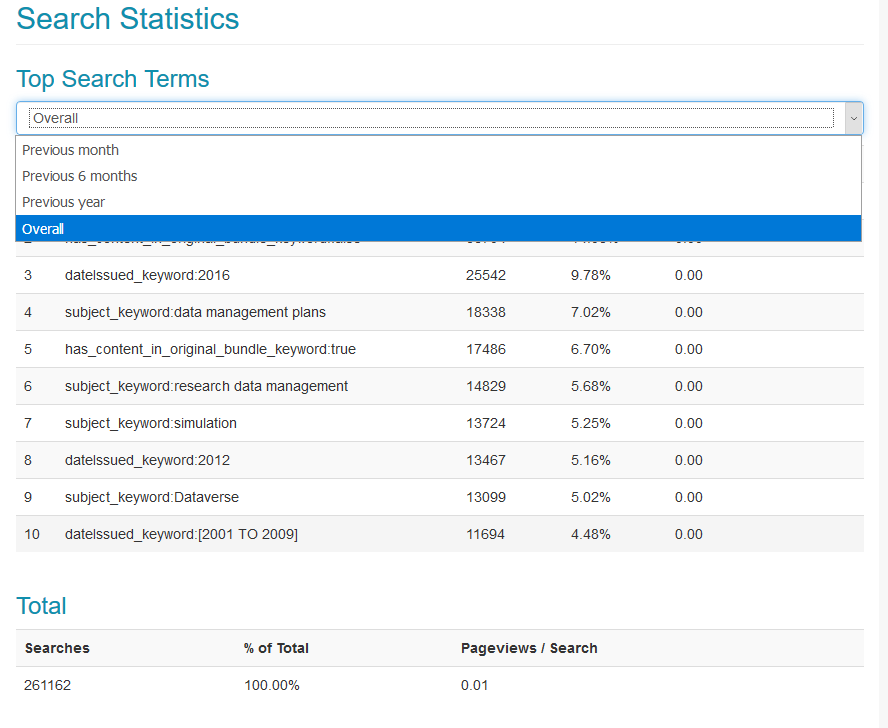
Search Query Statistics
Search query statistics can be accessed from the lower end of the navigation menu.
The dropdown on top of the page allows you to modify the time frame for the displayed statistics.
The Pageviews/Search column tracks the amount of pages visited after a particular search term. Therefor a zero in this column means that after executing a search for a specific keyword, not a single user has clicked a single result in the list.
Please note that when a user uses faceted browsing, a click on one of the Browse facets also counts as a search, because clicking a facet sends a search query to the Discovery index.
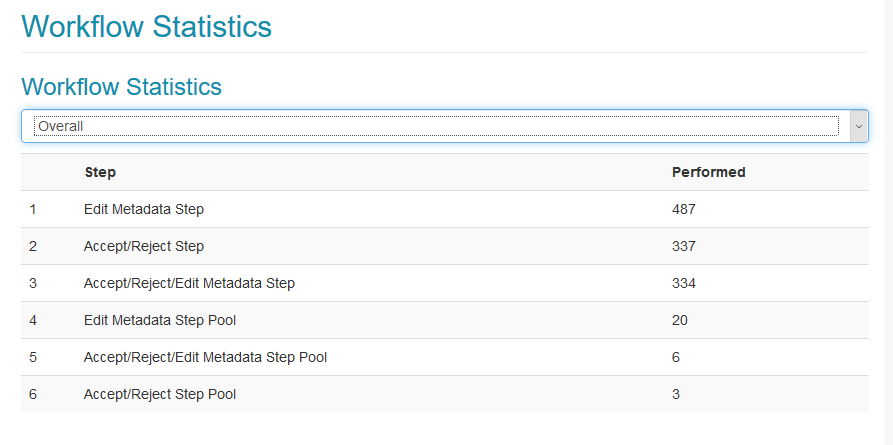
Workflow Event Statistics
Workflow statistics can be accessed from the lower end of the navigation menu.
These statistics track each time a Workflow step is taken.
The dropdown on top of the page allows you to modify the time frame for the displayed statistics.
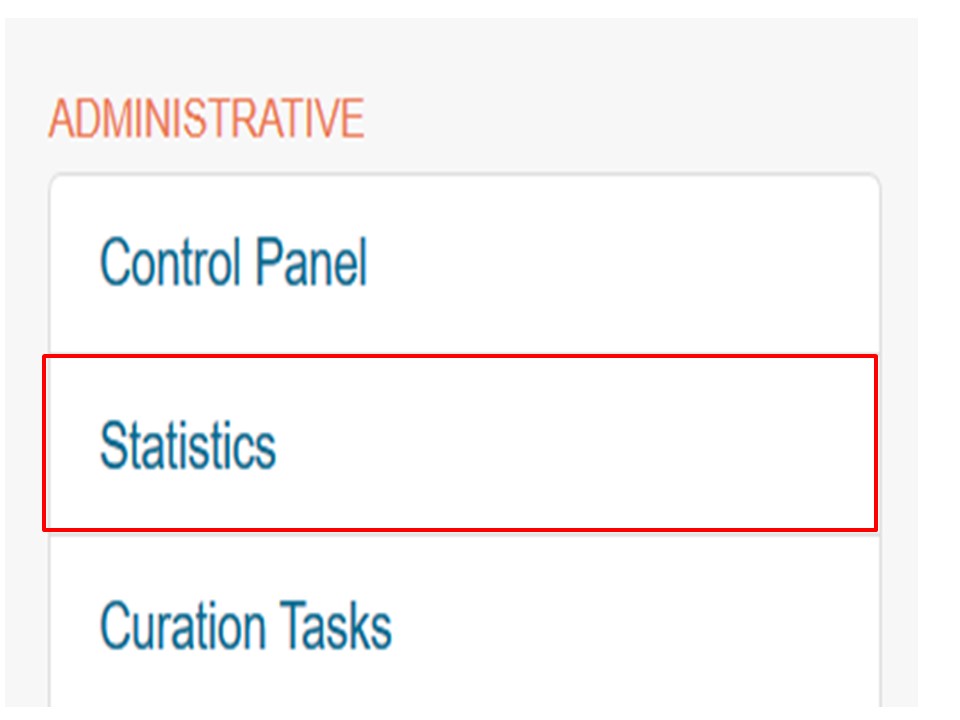
System Statistics (Repository-wide)
Certain repository-wide statistics and monthly reports are available to administrators in the Administrative section of the navigation bar:
Sometimes it takes a few moments for the reports on this page to generate. Once they do, Administrators should see an overview of statistics for the repository as a whole…
…as well as a series of monthly reports that appear in the right navigation menu:
The monthly reports will contain the same repository-wide statistics limited to the month of the report:
Definitions
General Overview
The “General Overview” shows information about the repository during the time specified.
Items Archived: Number of items archived in the repository during the time period, regardless of whether the item was later withdrawn or deleted.
Bitstream Views: Number of times any bitstream (i.e. a file associated with any item) was viewed/downloaded.
Item Views: Number of times any item was viewed.
Please note: An “item” is a record in DSpace while a “bitstream” is a file associated with an item. For example, this link references an item and this link goes to a bitstream.
Collection Views: Number of time a Collection page has been viewed.
Community Views: Number of times a Community page has been viewed.
User Logins: Number of times any user has logged in.
Searches Performed: Number of searches performed in the repository
License Rejections: Number of times a license has been rejected
OAI Requests: Number of times an outside service has made an OAI request on the repository.
Archive Information
All Items: The number of items available in the repository during the specified time frame. It will not include withdrawn or deleted items. It may, however, include items available in the repository via OAI-PMH harvesting (i.e. metadata records harvested via the OAI protocol and not via item submission).
Research Paper: The number of items available in the repository that are research papers.
Thesis or Dissertation: The number of items available in the repository that are theses or dissertations.
Preprint: The number of items available in the repository that are preprints.
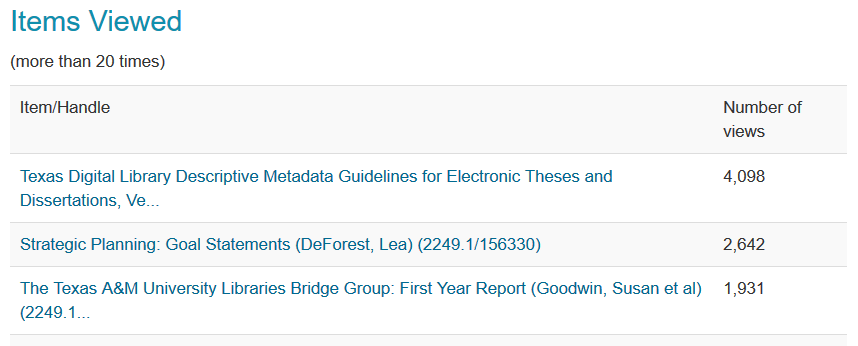
Items Viewed
This sections shows the item handle and number of views for any item in the repository viewed more than 20 times during the time period.
Google Analytics
By default, TDL-hosted DSpace repositories enable the recording of Google Analytics data within DSpace. Upon setup, TDL configures the repository to record User Interface traffic that can be accessed via the Google Analytics dashboard. Institutional repository managers may view the data in their Google Analytics dashboard if they provide us with a gmail account with which to share it.
More about Google Analytics in DSpace repositories can be found in the LYRASIS wiki.